7 Tips for Choosing Optical Inspection Tools
Choosing Optical Inspection Tools is not just a matter of buying a sharper camera. The right setup must reveal the defect that matters, under real production conditions. A faint scratch on brushed metal may disappear beneath overhead glare. A chipped edge on a clear plastic part may need backlighting instead. Machine-vision specialist David Dechow’s published guidance can be paraphrased this way: “Match the imaging setup to the inspection task.” This is a paraphrase, not a verbatim quotation.
A useful selection process begins with the part, the defect, and the required decision. Consider field of view, working distance, resolution, lens distortion, illumination, and inspection speed. Then test samples with the actual surface finish, color, and variation found on your line. Small details matter. One lens may capture the whole component, while another resolves a hairline crack. A ring light can flatten texture; angled lighting may make raised edges stand out. No single configuration wins every time. That part is easy to overlook.
These seven tips will help compare tools against measurable needs, not impressive catalog images. They also cover integration, repeatability, software, and support. Record what the system misses, not only what it detects. A few test pieces are rarely enough. Real production brings dust, vibration, and changing operators. Even a promising trial can be misleading. Use the guide to ask sharper questions, plan a realistic evaluation, and choose equipment that fits the inspection—not the other way around.
Define the Inspection Task and Required Measurement Accuracy
Define the inspection task before selecting an optical tool. Are you checking a part’s presence, measuring a bore, or detecting a surface defect? Each task needs different optics, lighting, software, and measurement capability. NIST guidance stresses that measurement results need stated uncertainty and traceability; a tool’s displayed resolution alone does not establish accuracy. The 2019 Deloitte-MAPI Smart Factory Study found that 86% of surveyed manufacturers expected smart factory initiatives to drive competitiveness within five years. Reliable inspection data starts with clear measurement requirements.
Tip: Turn the drawing into a test. Record the feature, tolerance, material, surface finish, and inspection speed. For a small machined hole, specify the diameter range and acceptable error, then test representative parts under actual lighting. Include fixturing and operator variation. Easy to miss.
Set the required accuracy against the tightest tolerance, not the average feature. Ask suppliers for repeatability data and uncertainty details under conditions close to your production line. Then run a trial with known reference parts. A camera may resolve tiny pixels yet still mismeasure a reflective edge or a curved surface. I would not treat one successful sample as proof; that shortcut is tempting, and sometimes wrong. Recheck after changing the lens, lighting, fixture, or software settings.
Compare Optical Technologies for the Target Materials and Defects
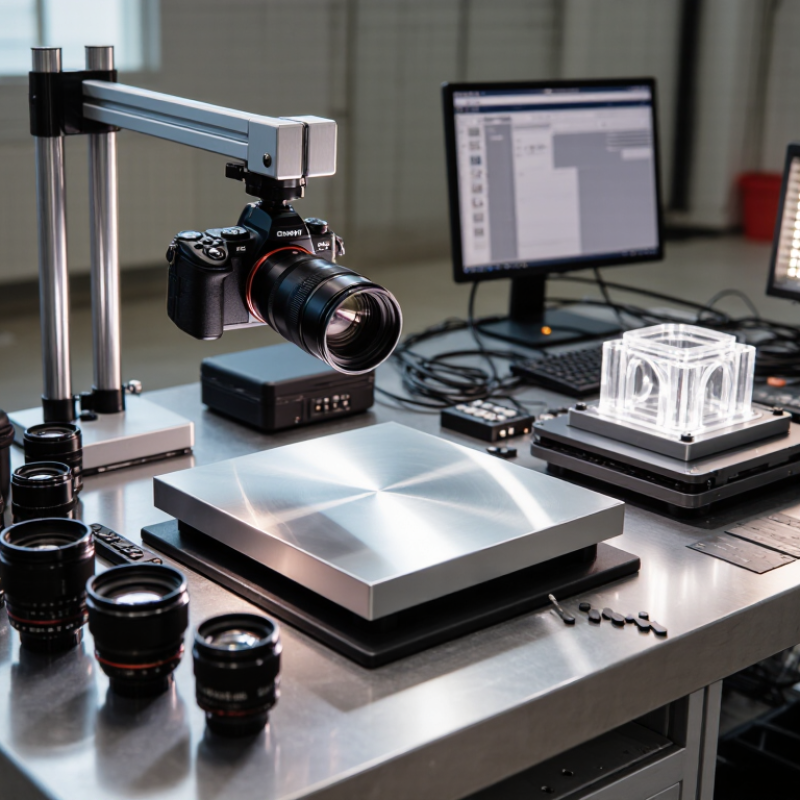
Choose the optical method around the material’s surface and the defect you need to find. On polished metal, coaxial bright-field lighting can reveal scratches and dents, while dark-field lighting makes fine edges scatter light against a dark background. Transparent glass needs transmitted illumination to expose bubbles or inclusions. Plastics can be trickier: glare may hide shallow marks, so test diffuse lighting or cross-polarization before fixing the setup. No method is perfect.
Match the measurement to defect depth, too. A 2D camera can locate stains and missing features, but it cannot reliably measure a pit’s height. Confocal or interferometric methods capture surface profiles; focus-variation systems may suit rougher finishes. For layered or coated materials, UV or near-infrared imaging can add contrast, though the useful wavelength depends on the material and coating. Jordan and Kurtz’s 2013 review in Progress in Photovoltaics analyzed nearly 2,000 photovoltaic degradation rates and reported a median performance loss of about 0.5% per year. That figure is not an optical-inspection result, but it shows why small defects deserve careful screening. Validate the choice with real samples, including borderline defects; clean lab coupons can make a weak setup look convincing.
Evaluate Resolution, Field of View, and Operating Conditions
Choosing an optical inspection tool starts with the smallest defect you need to detect. If a hairline crack is 0.2 millimeters wide, the image must show it across several pixels, not just as a faint blur. A practical target is three to five pixels across the feature, then a test with real samples. Sensor resolution alone can mislead; lens quality, focus, and lighting all affect usable detail. Field of view matters just as much. A wider view covers more parts per image, but leaves fewer pixels for each small feature. Check the working distance, too. A cramped production line may not allow the camera position shown in a product diagram. Small details matter.
Operating conditions can change inspection results. Test with the actual surface finish, lighting, and part position, including glossy areas that may create glare. Test it cold. Temperature shifts can alter focus or equipment alignment, while vibration may soften images during a fast production cycle. Dust and changing ambient light can also reduce consistency. In practice, a setup that performs well on a clean workbench may struggle beside moving machinery. Record sample images under normal and difficult conditions, and compare them against clear pass-or-fail criteria. I would leave time to revisit those criteria; borderline defects are easy to judge differently when the lighting changes. A reliable choice is one that keeps the required detail visible across the full field of view and throughout the real operating environment.
Assess Software, Integration, and Ease of Use
Treat the software as part of the measurement system, not a screen added afterward. During a trial, inspect real samples, including scratched, reflective, and borderline parts. Check whether operators can adjust inspection regions, set tolerances, and review defect images without hunting through menus. A clear image history helps technicians compare a new reject with a saved reference. Ask how the software handles false rejects and whether threshold changes are logged. Small details count. Can reports export measurements, timestamps, and images in formats your quality team already uses? A polished dashboard may still hide awkward workflows.
Test the tool beside the equipment it must serve, not on a clean demonstration bench. Confirm it can exchange results with existing cameras, conveyors, databases, or production software. Agree on what happens if a connection drops: does the line pause, save images, or continue without inspection? Try it live. Watch an operator load a new recipe, recover from a missed part, and find an image from last week. If routine tasks require an engineer, ease of use may be overstated. Training time, access controls, and clear error messages deserve attention. That matters. Integration is rarely plug-and-play; cables, data fields, and timing can reveal gaps after installation. Run a small pilot using your actual cycle time and defect criteria, then record setup effort and review disagreements. One smooth demonstration is not enough; production conditions are less tidy.
Balance Total Cost, Support, and Future Scalability
An optical inspection tool is not just a camera and software; it becomes part of the production routine. Compare its lifetime cost, including optics, lighting, calibration, integration, training, and changeover downtime. A low purchase price can hide costly false rejects or frequent manual reviews. Small details matter.
Deloitte and MAPI’s 2024 Smart Manufacturing Survey found that 86% of manufacturing executives expect smart factory solutions to drive competitiveness within five years. The International Federation of Robotics reported 4.28 million industrial robots operating worldwide in 2023, up 10% year over year. These figures raise a practical question: will inspection data connect cleanly with today’s lines and future automation? Ask suppliers to test your own parts, including reflective surfaces, mixed batches, and known borderline samples. Track false rejects, missed defects, and recipe-change time.
Support deserves the same scrutiny as image quality. Check response hours, spare-part lead times, remote troubleshooting, update policies, and training for night-shift technicians. Price a three-year service plan, then estimate costs after the warranty ends. A system with open data exports and room for extra cameras may scale more easily. But open interfaces do not guarantee simple integration; test them with your controls team. Forecasts are not factory reality. I would keep a budget buffer: the first production run often reveals one awkward edge case.